

Track Engagement and Measure Content Performance: Appspace Intranet Insights Guide
Appspace provides a range of insights tools designed to help Admins and Publishers understand how employees interact with intranet content. These tools span the Admin Console and the Employee View, covering everything from high-level engagement trends down to individual post performance.
This guide walks you through accessing intranet insights in the Console and Employee View, understanding what each metric means, using the AI Insight Assistant, and working with reports and exports.
What This Guide Covers
This guide walks you through the following:
- Accessing intranet insights in the Console, including the Intranet Dashboard, Space Insights, Search Insights, and Campaigns
- Viewing feed-level insights for Channels, Communities, and Topics in the Employee View
- Viewing content-level insights for individual Stories, Pages, and Posts
- Using the AI Insight Assistant to ask questions about your data
- Creating and scheduling exportable reports
- Understanding what each metric means and where to find it
Prerequisites
- Platform License
- Account Owner, Location Admin, or Publisher Role - Account Owners and Location Admins have full access to all insights. Publishers can view insights for content they manage.
- Active Appspace Public/Private Cloud User Account
Console Insights
The Appspace Console provides several areas where Admins can view and analyze intranet content performance. This section covers each of them.
Note: Previously, the Analytics module included sections for Channel Analytics, Content Analytics, and Apps Analytics alongside intranet data. These areas now have their own dedicated system dashboards in the Insights module: Digital Signage (channel analytics), Library Content (content analytics), and Platform Overview (apps, devices, and account-wide summaries). This guide focuses on intranet-specific insights only.
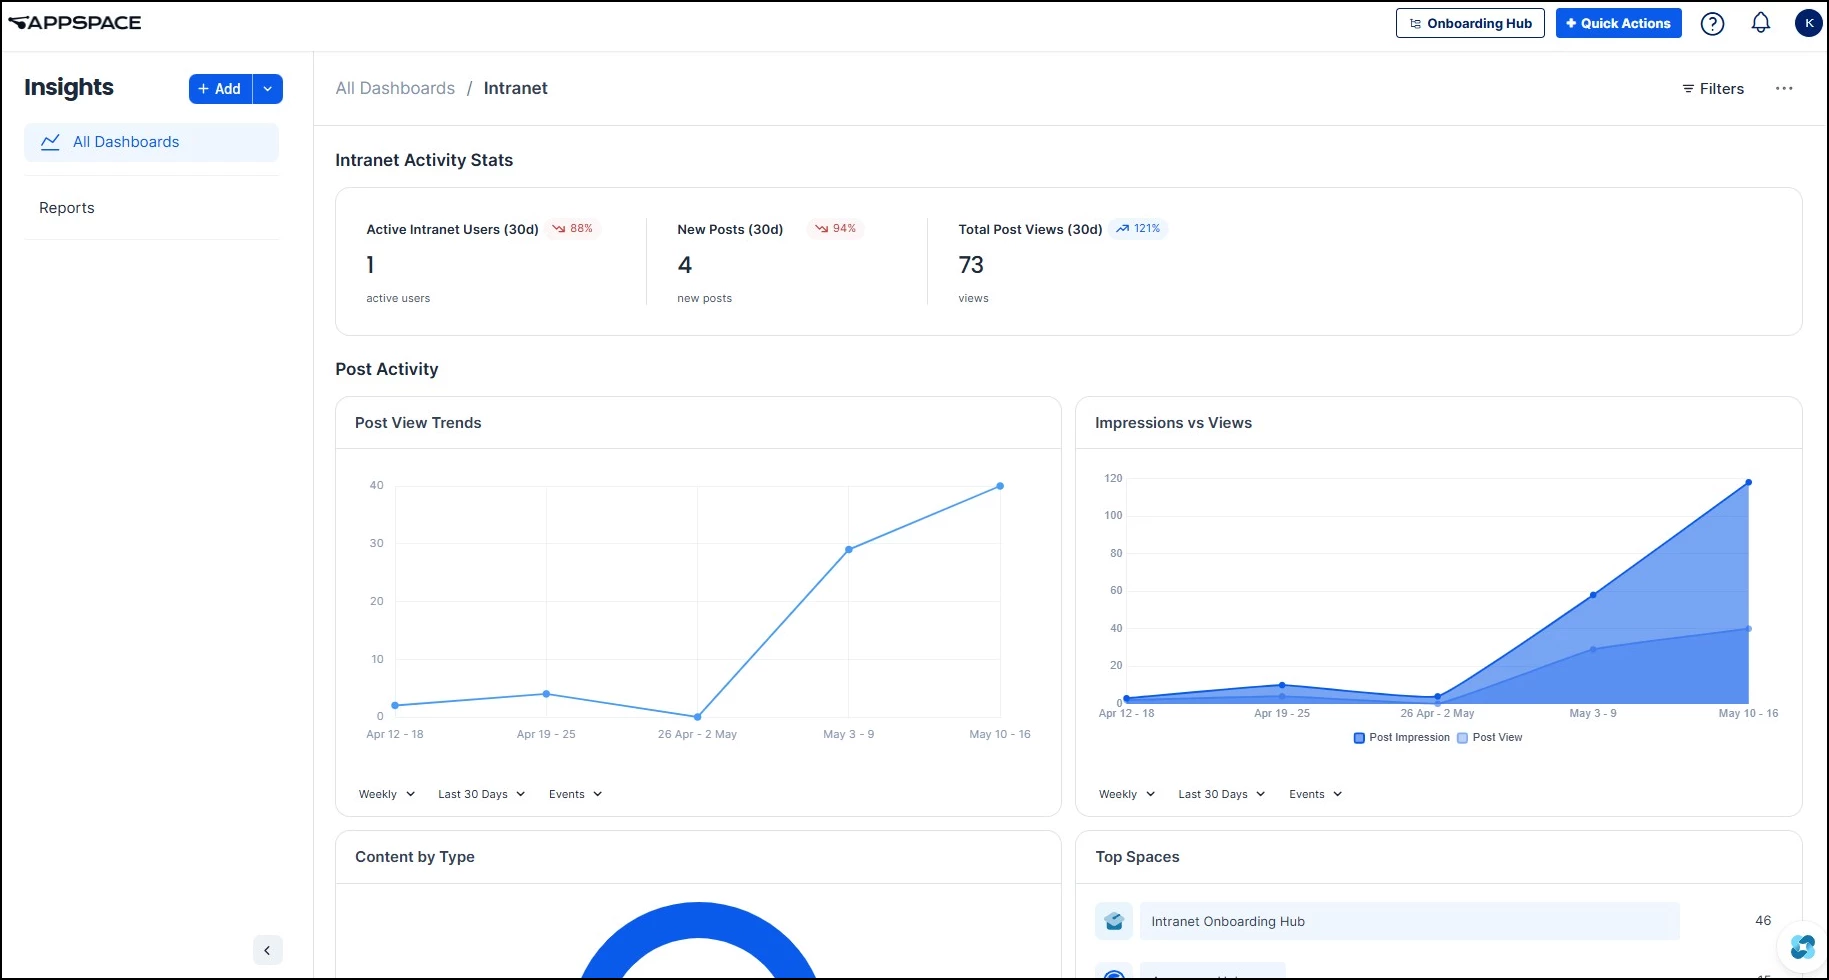
Intranet Dashboard
To access the Intranet dashboard, navigate to Insights from the left-hand navigation, then click Intranet from the All Dashboards list.
The dashboard is divided into two areas: summary stats at the top, and detailed analytics widgets below.
Intranet Activity Stats
The summary bar at the top of the dashboard displays three key metrics for the selected period:
- Active Intranet Users - Number of unique users who visited the intranet during the period, with percentage change from the previous period
- New Posts - Number of new posts published during the period, with percentage change
- Total Post Views - Total number of post views during the period, with percentage change
Post Activity
Below the summary stats, the Post Activity section provides detailed analytics widgets that you can filter by time range and event type:
- Post View Trends - A trend chart showing how post views change over time, helping you identify peaks and drops in readership
- Impressions vs Views - Compares how often posts appeared in feeds versus how often they were actually opened, revealing the gap between visibility and engagement
- Content by Type - A breakdown of intranet content by type, showing the mix of content formats being published
- Top Spaces - Ranks your Spaces by activity, showing which Communities and Topics are driving the most traffic
- Post Attachment Opens - Tracks how often users open attachments within posts, indicating whether supplementary materials are adding value
- Post Media Views - Shows how often users view embedded media (images, videos) within posts
You can also build custom dashboards focused on specific intranet metrics. For a full walkthrough, see Unlock Real-Time Workplace Intelligence: Your Guide to the New Insights Dashboards.
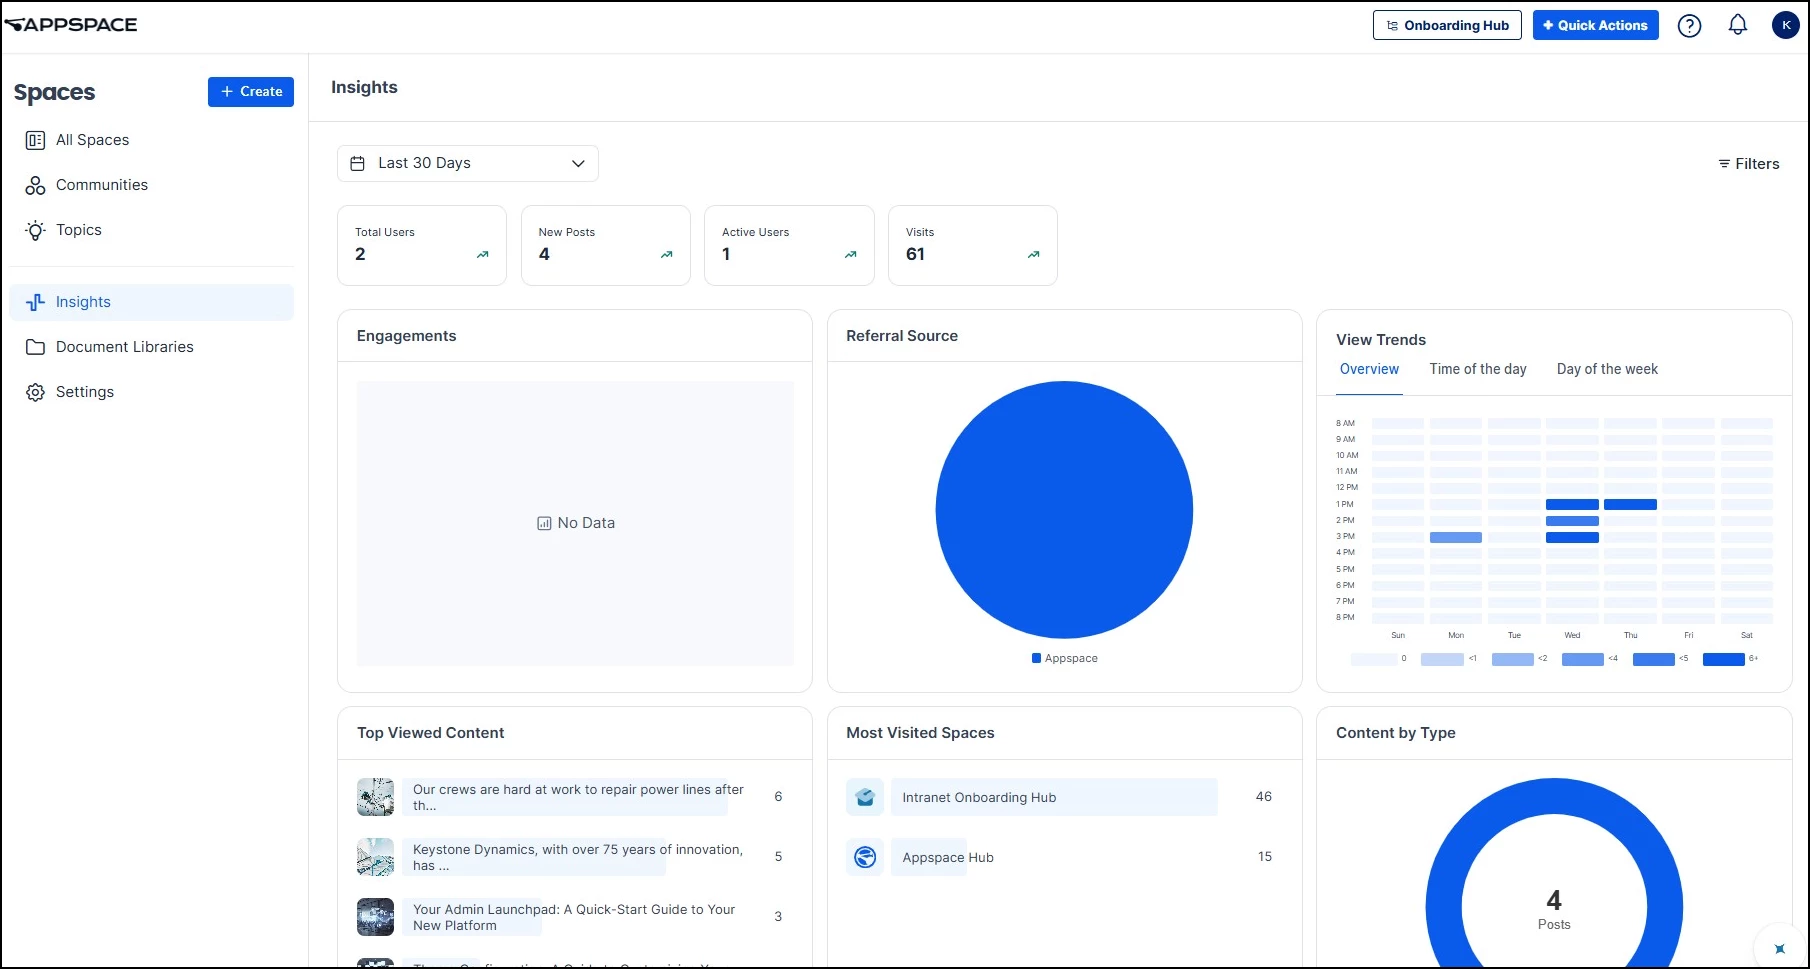
Space Insights
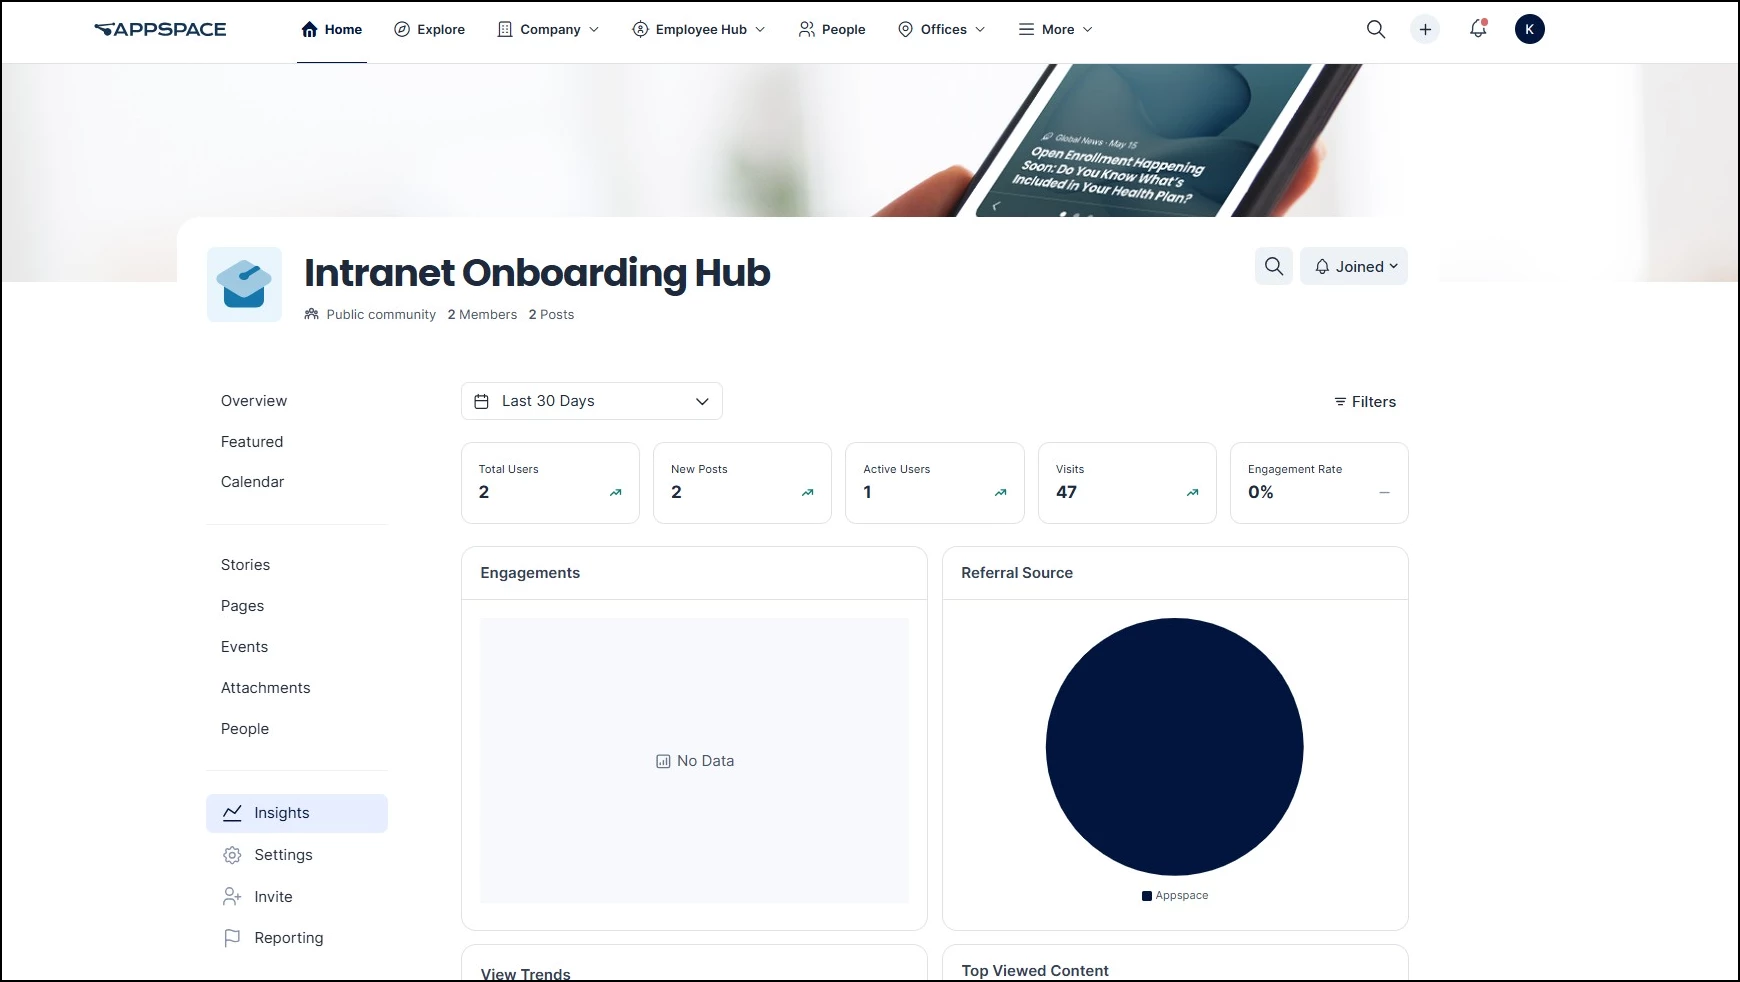
You can view the analytics of all of your Spaces, including Communities and Topics, by going to Spaces and then clicking Insights.
On the Insights dashboard, click the calendar dropdown to select your desired time frame. The following data points are available:
- Total Users
- New Posts
- Active Users
- Visits
- Engagements
- Referral Source
- View Trends
- Top Viewed Content
- Most Visited Feeds
- Posts by Type
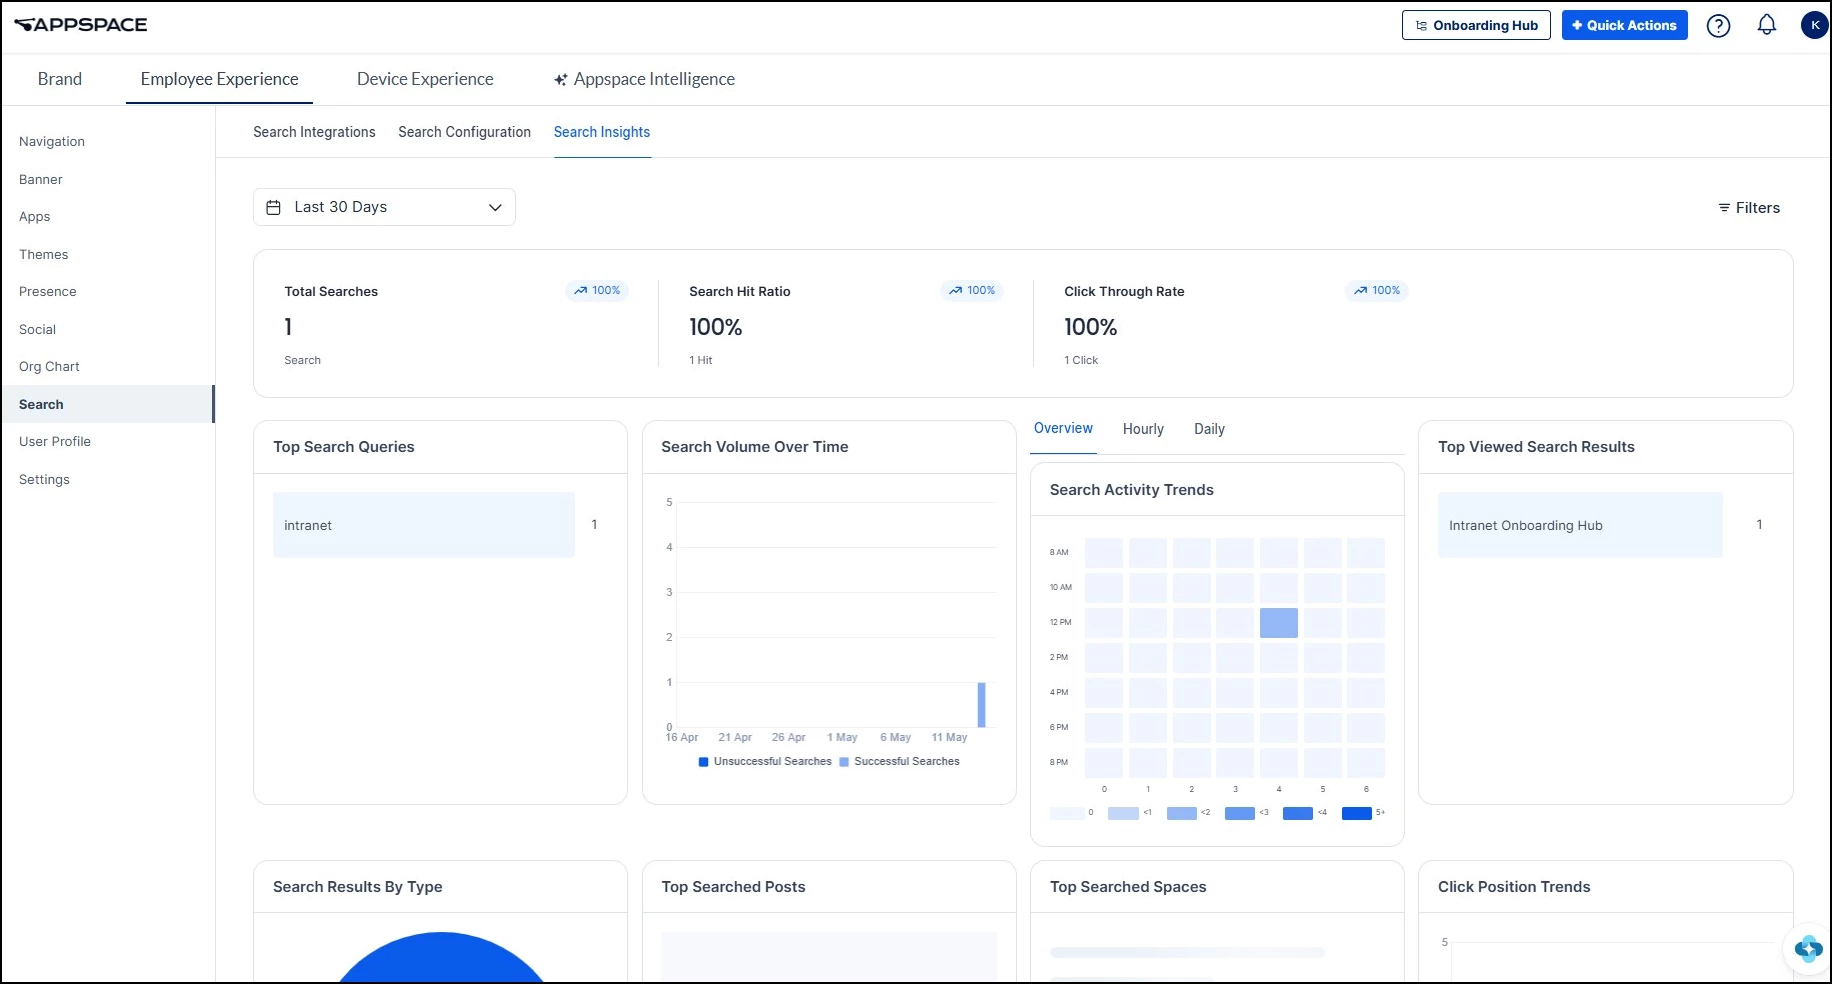
Search Insights
Search Insights enable administrators to view a summary of user search behavior within a particular time frame. To access this data, go to Settings > Configuration > Employee Experience > Search > Search Insights. Then click the calendar dropdown to select a time frame.
The dashboard captures the following data points:
- Total Searches
- Search Hit Ratio
- Click Through Rate
- Top Search Queries
- Search Volume Over Time
- Search Activity Trends
- Top Viewed Search Results
- Search Results by Type
- Top Searched Posts
- Top Searched Spaces
- Click Position Trends
Campaigns
Campaign insights are available in three places: the Campaigns system dashboard in the Insights module, and the Overview and Insights tabs within individual campaigns.
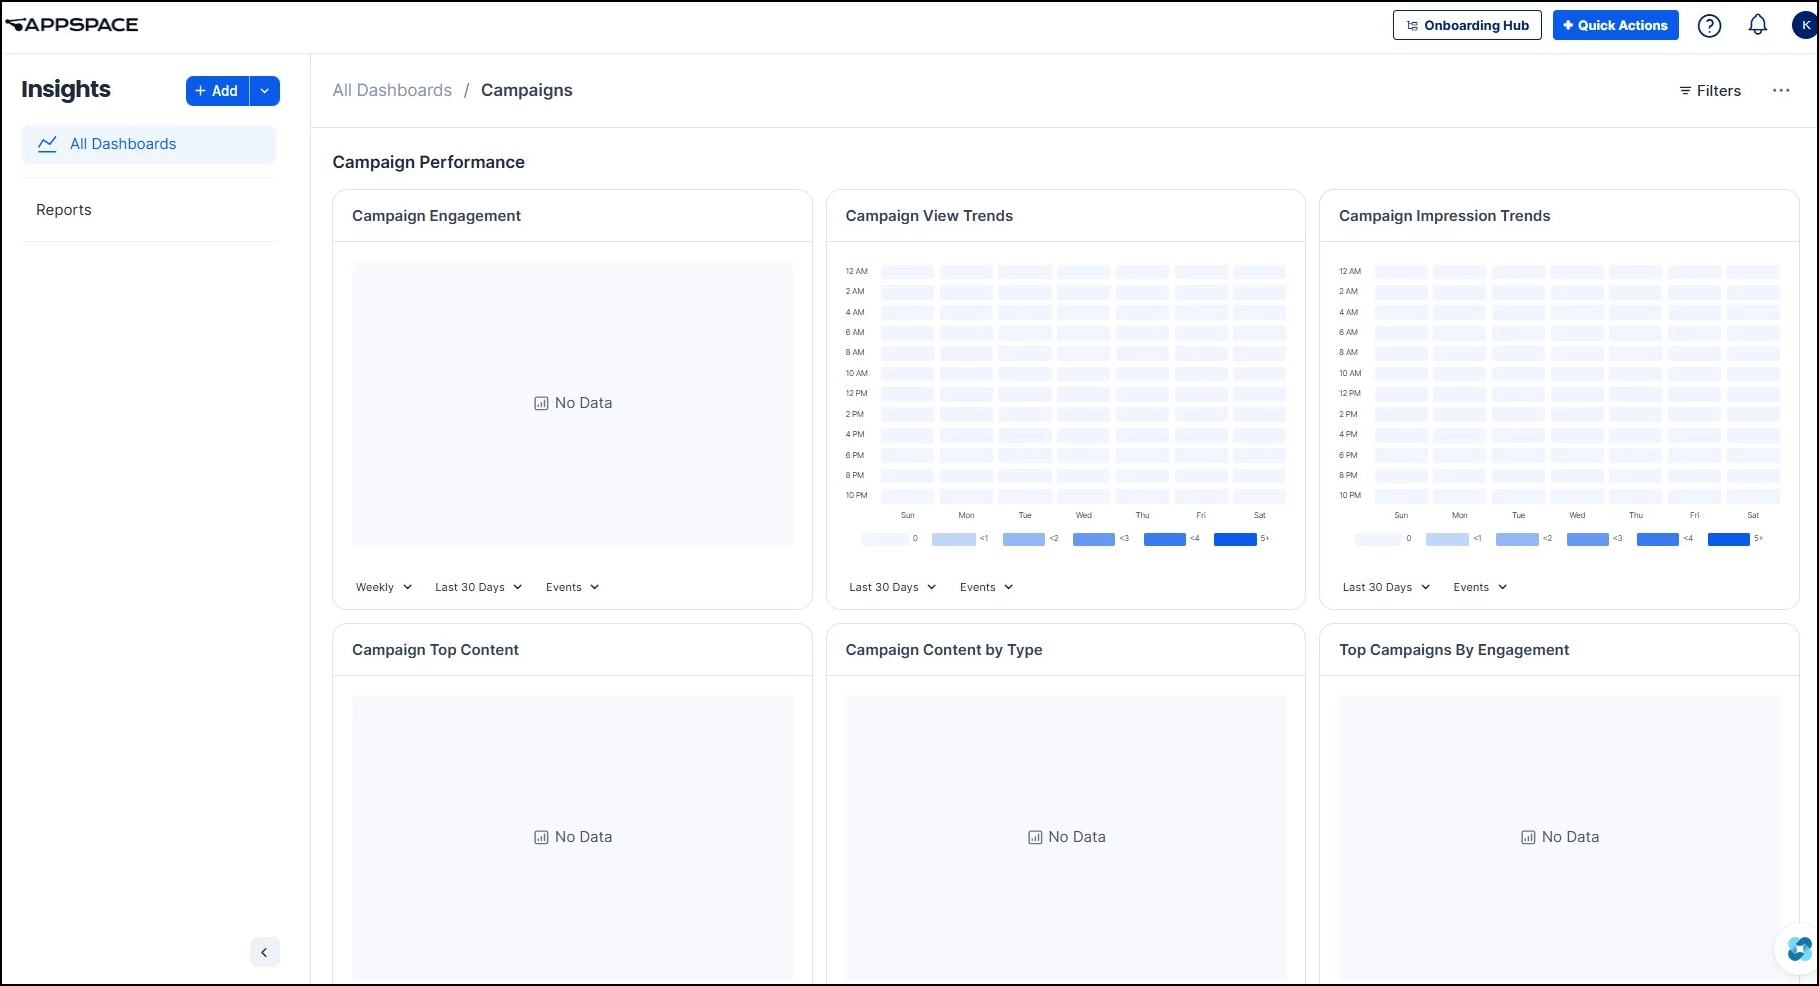
Campaigns System Dashboard
Navigate to the Insights module and click the Campaigns dashboard from the All Dashboards list. This provides an overall view of campaign performance across all your campaigns, with the following widgets under the Campaign Performance heading:
- Campaign Engagement - Tracks engagement trends across all campaigns over time
- Campaign View Trends - A heatmap showing when audiences are viewing campaign content by day and hour
- Campaign Impression Trends - A heatmap showing when campaign content is appearing in feeds by day and hour
- Campaign Top Content - Ranks content items across all campaigns by views
- Campaign Content by Type - Breaks down campaign content by format type
- Top Campaigns By Engagement - Ranks your campaigns by engagement, showing which initiatives are driving the most interaction
- Top Campaigns By Views - Ranks your campaigns by total views
- Campaign Referrer Source - Shows where campaign traffic is coming from across all campaigns
- Campaign Audience Trends - Tracks unique audience activity across campaigns over time
Individual Campaign: Overview Tab
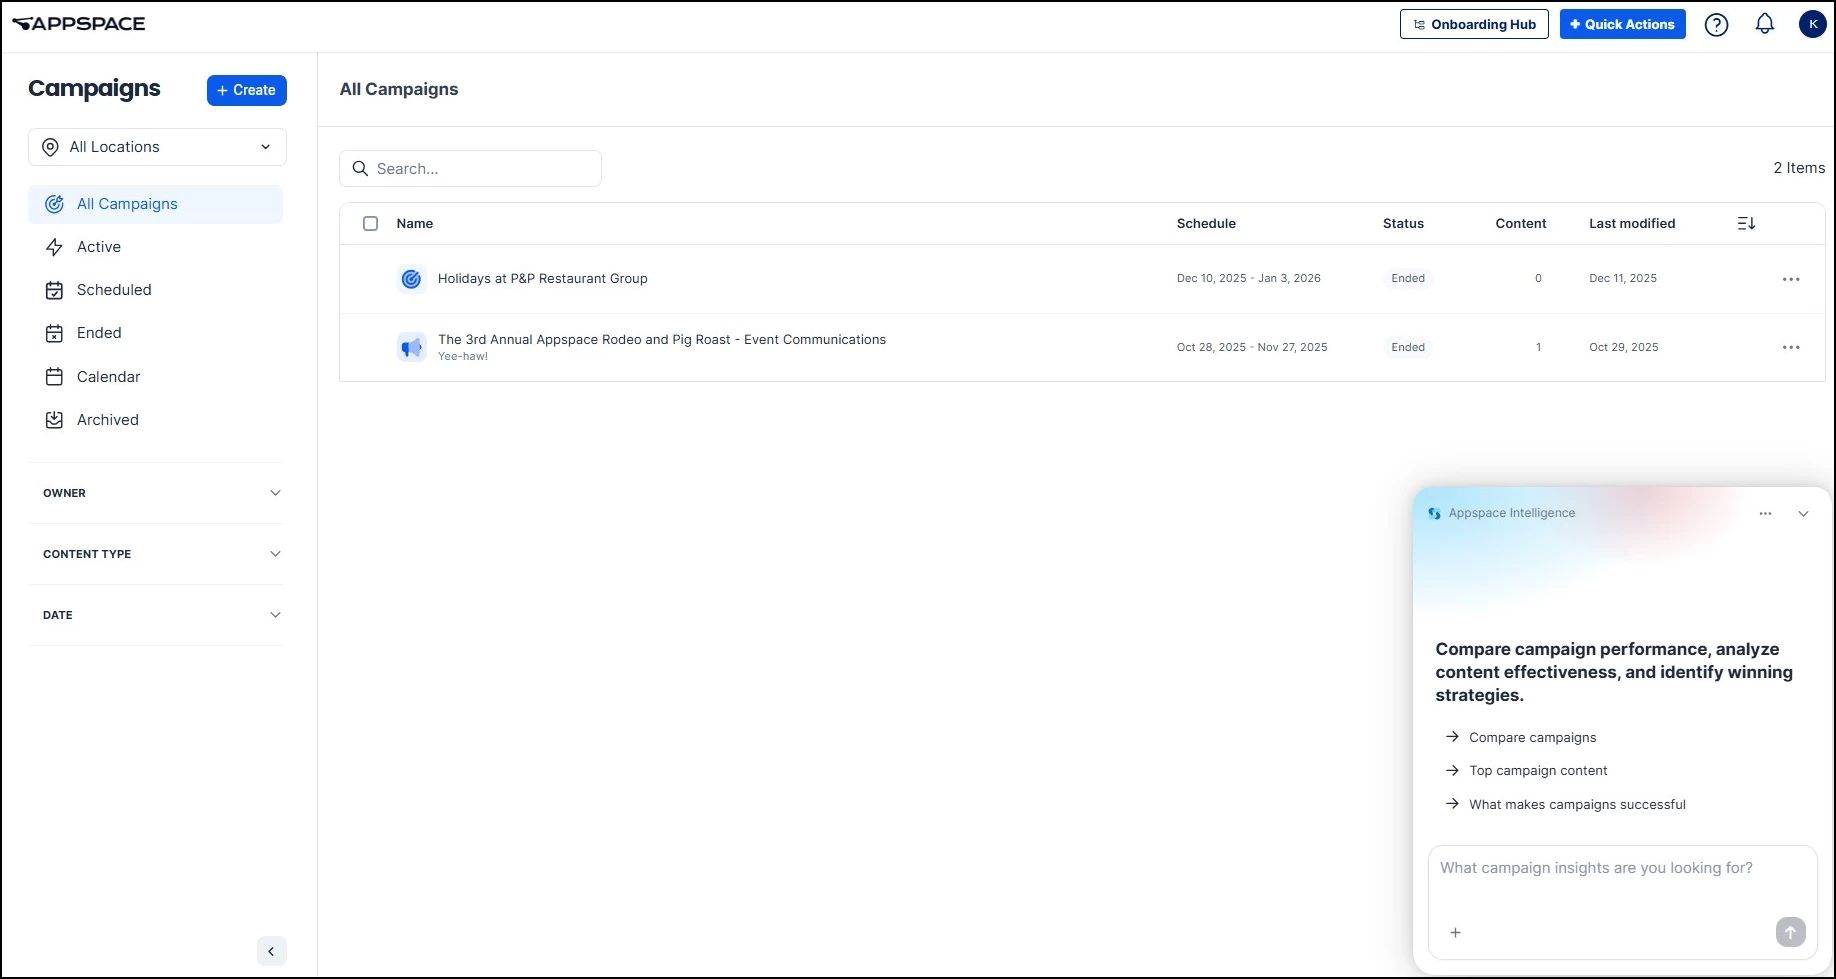
To view insights for a specific campaign, access the Campaigns module from the ☰ Appspace menu by selecting Campaigns, then click into a campaign. You can filter the campaign list by status (Active, Scheduled, Ended, Archived) as well as by Owner, Content Type, and Date.
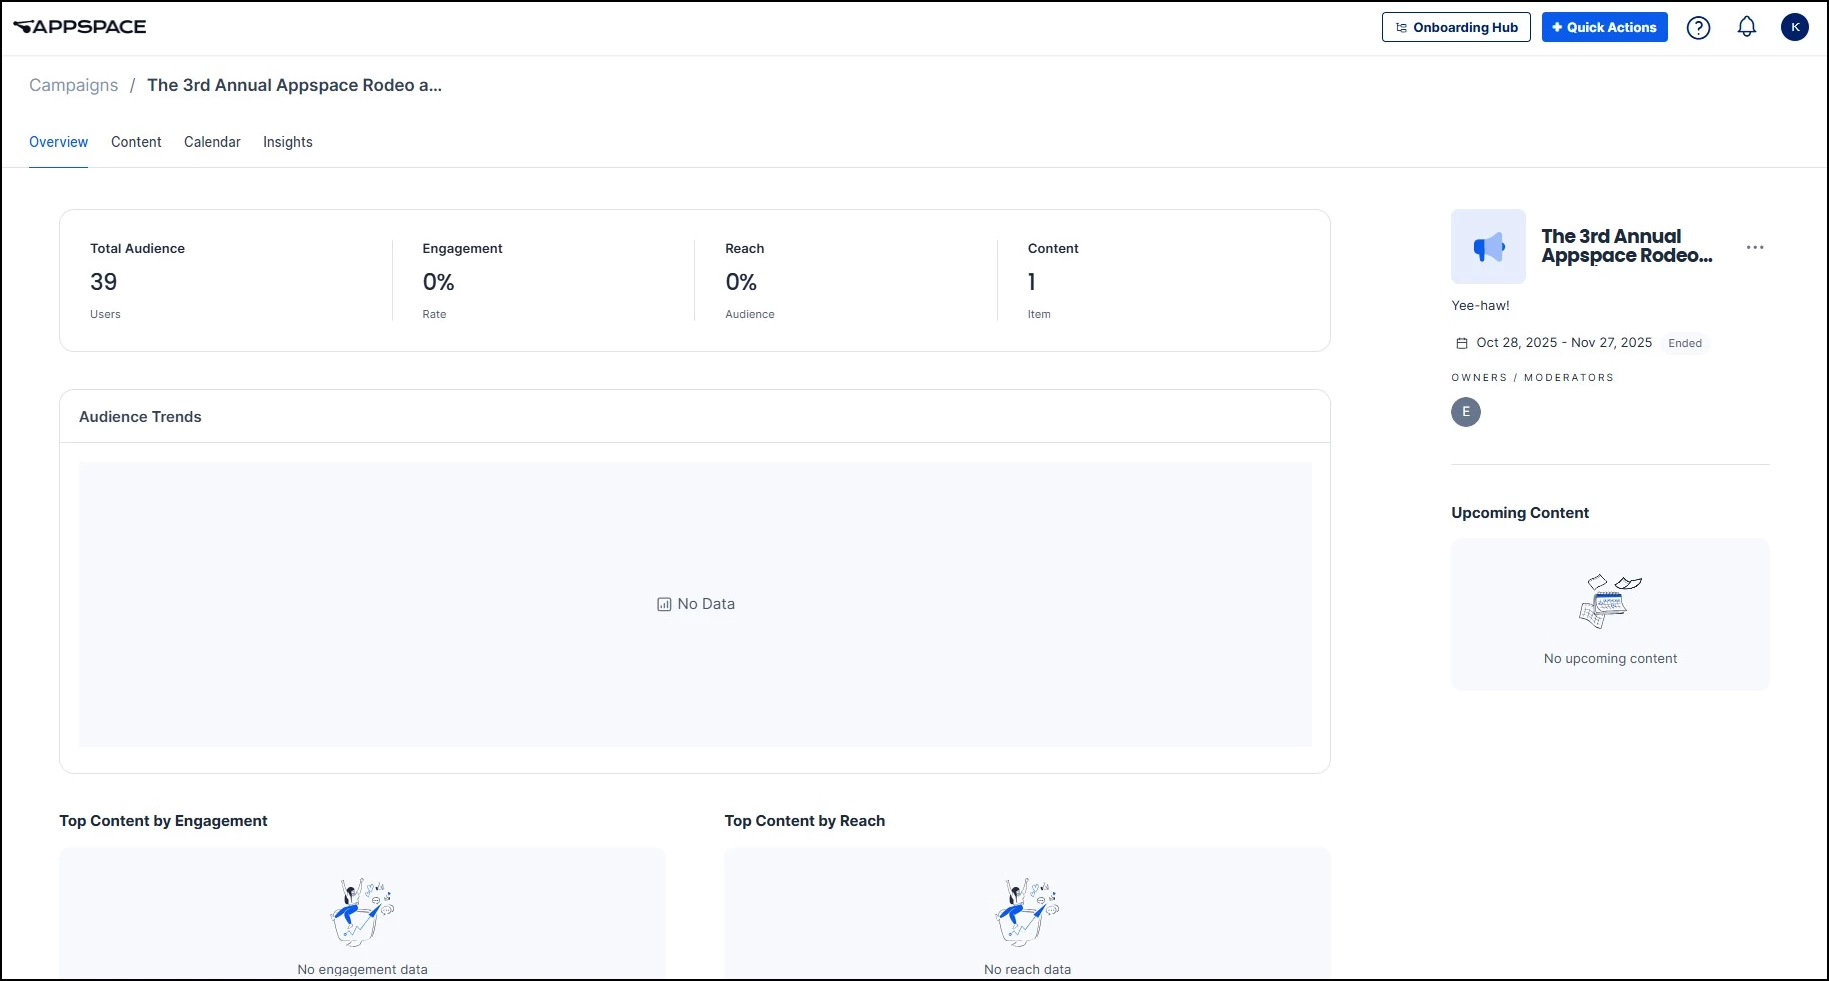
The Overview tab provides a high-level snapshot of campaign performance. The summary bar at the top displays:
- Total Audience
- Engagement
- Reach
- Content
Below the summary, you will find:
- Audience Trends - A trend chart showing how your campaign audience engagement evolves over the campaign duration
- Top Content by Engagement - Ranks the content items in the campaign by engagement, showing which pieces are driving the most interaction
- Top Content by Reach - Ranks the content items in the campaign by audience reach, showing which pieces are being seen by the most people
Individual Campaign: Insights Tab
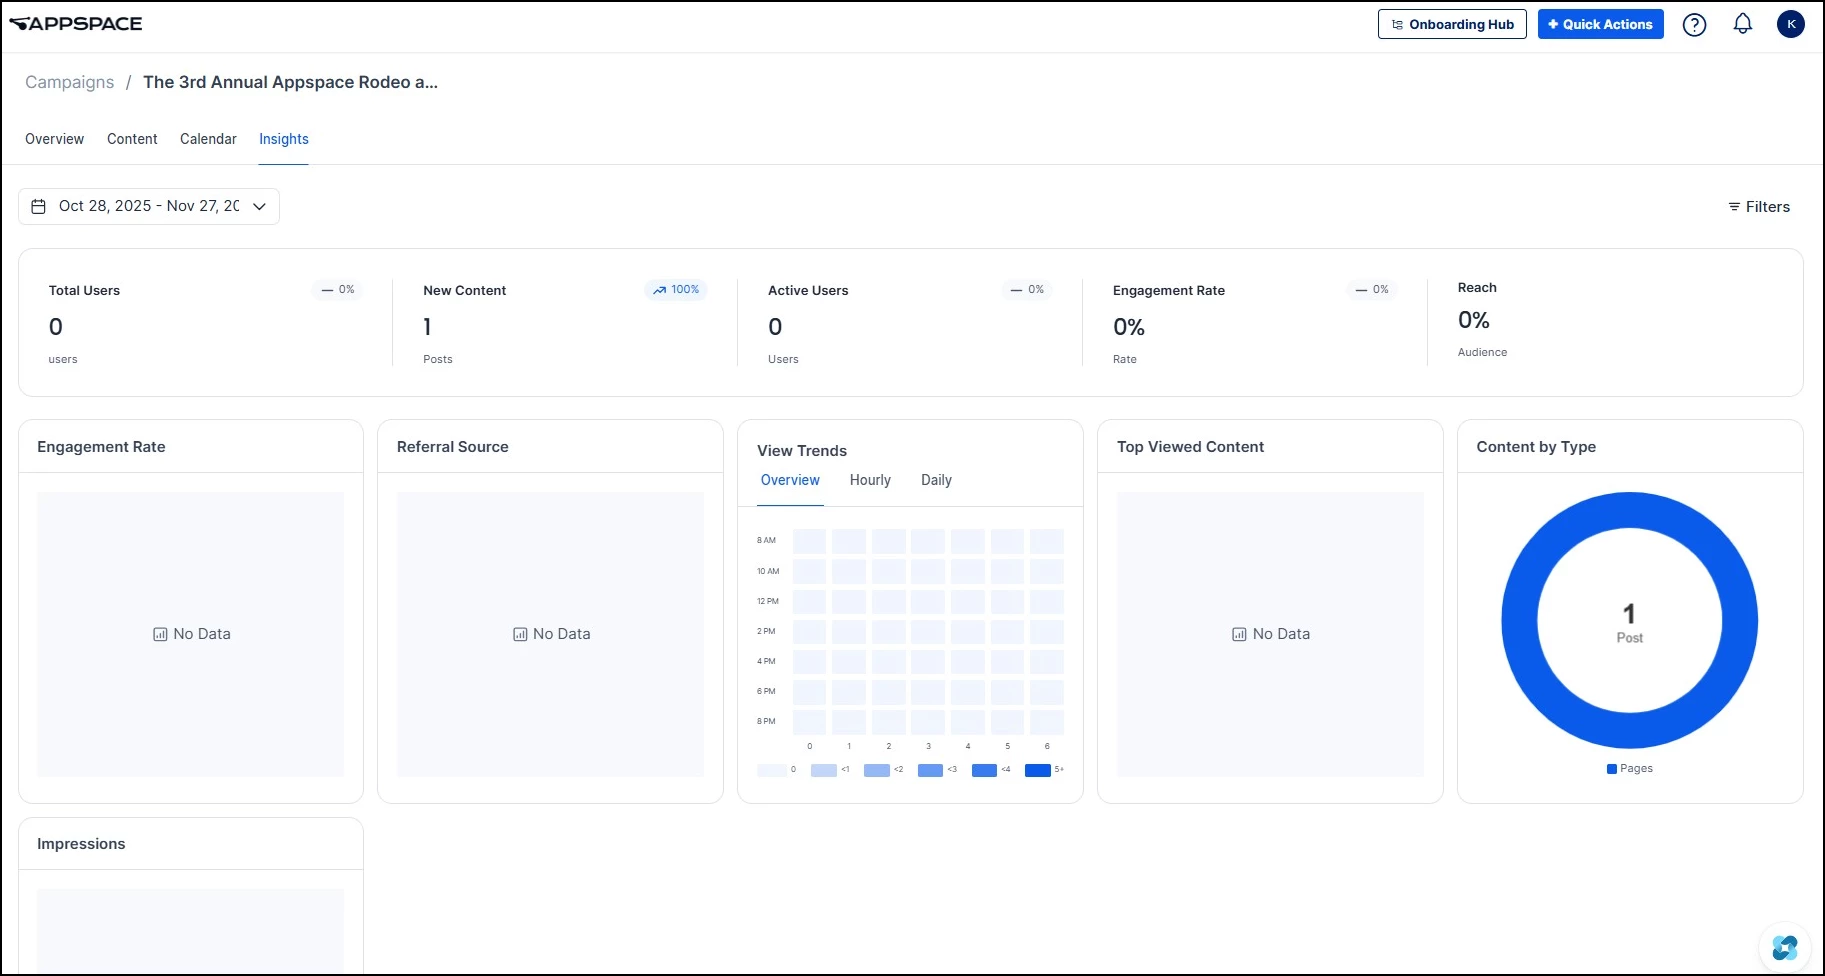
The Insights tab provides detailed analytics with filterable time ranges. The summary bar at the top displays:
- Total Users
- New Content
- Active Users
- Engagement Rate
- Reach
Below the summary, you will find detailed analytics widgets:
- Engagement Rate - Tracks the percentage of users who interacted with campaign content over time
- Referral Source - Shows where campaign traffic is coming from (Intranet, email, Microsoft Teams, or other channels)
- View Trends - A heatmap showing when your audience is viewing campaign content, with Overview, Hourly, and Daily breakdowns
- Top Viewed Content - Ranks campaign content items by number of views
- Content by Type - Breaks down campaign content by format type
- Impressions - Shows how many times campaign content appeared in user feeds
To start tracking campaign performance, you will first need to create a campaign. For step-by-step instructions, see Campaigns: User Guide.
Using the Insight Assistant
If your organization has AI enabled, you can use the Insight Assistant to ask natural language questions about your data and make data-informed decisions. For example, you can ask it what the engagement trends are in your Spaces or to compare your Campaigns.
The Insight Assistant is currently available in Spaces > Insights, Campaigns, and Search. Click the star button in the bottom right corner to start asking the AI questions. To learn more about using the assistant, see Appspace Intelligence: Insight Assistants.
Creating Reports
Account Owners and Location Admins can create, customize, generate, and schedule reports from the Insights > Reports tab. Reports use metrics collected via Insights and export as .xlsx spreadsheets that can be downloaded immediately or scheduled to run regularly.
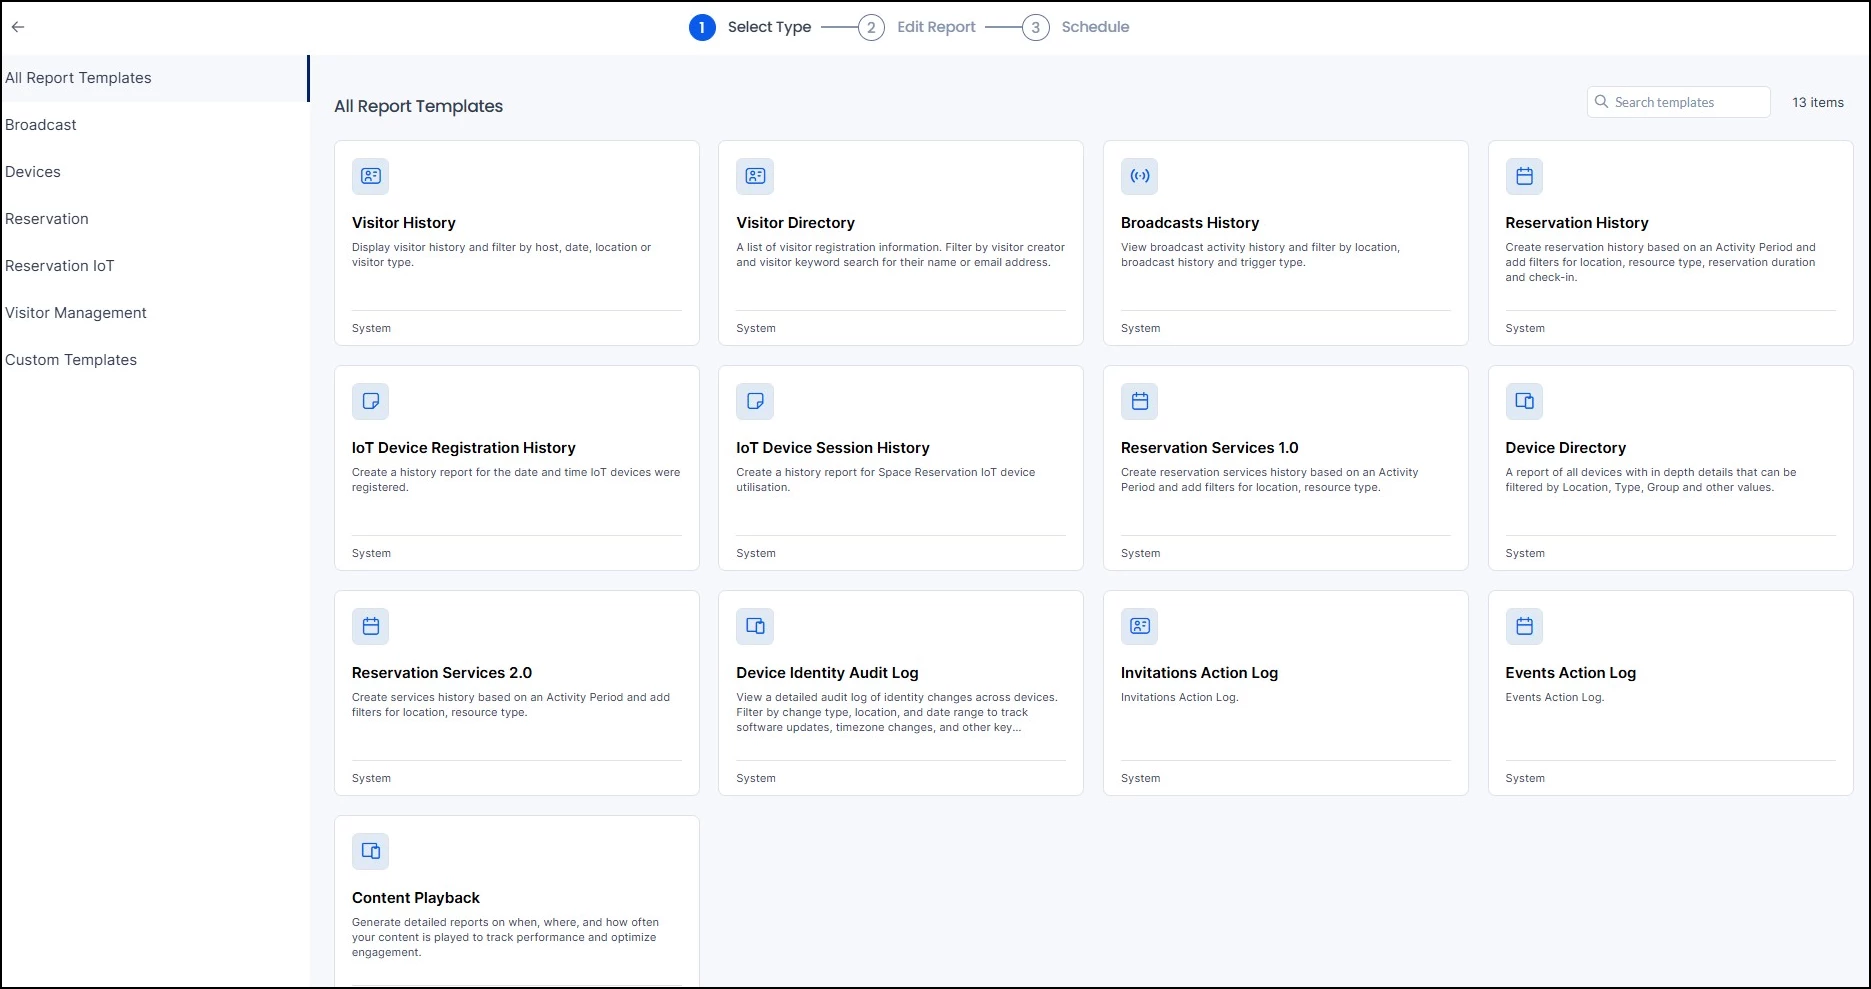
To create a report:
- Go to Insights > Reports and click Create Report.
- Select a report template. For Employee Comms, the most relevant template is Broadcasts.
- Customize the columns you want included in the report.
- Set the time period the report should cover.
- Choose a schedule (daily, weekly, monthly, or yearly) or generate the report immediately.
To learn more about configuring reports, see Browse and Navigate Reports.
Note: Additional report templates are available for Space Reservations, Visitor Management, and Devices for teams managing those areas.
Feed-Level Insights
In addition to the Console, Administrators and Publishers can view insights for specific feeds directly in the Employee View. This includes Channels, Communities, and Topics.
To access feed-level insights:
- Navigate to the feed (Channel, Community, or Topic) in the Employee View.
- Click Insights on the left-hand menu to open the insights dashboard.
- Use the calendar dropdown to select your desired time frame.
The following data points are available at the top of the dashboard:
- Total Users
- New Posts
- Active Users
- Visits
- Engagement Rate
Below these summary metrics, you will find graphs and visual representations of additional data:
- Engagements
- Referral Source
- View Trends
- Top Viewed Content
- Posts by Type
Tip: You can click into any of these data points to see the full list of information and download the data as an Excel file.
Content-Level Insights
You can also view insights for individual pieces of content, including Stories, Pages, and Posts. Administrators, Publishers, and content creators can all access these insights.
To access content-level insights:
- Open the Story, Page, or Post you want to review.
- Scroll to the bottom of the content to find the Insights section.
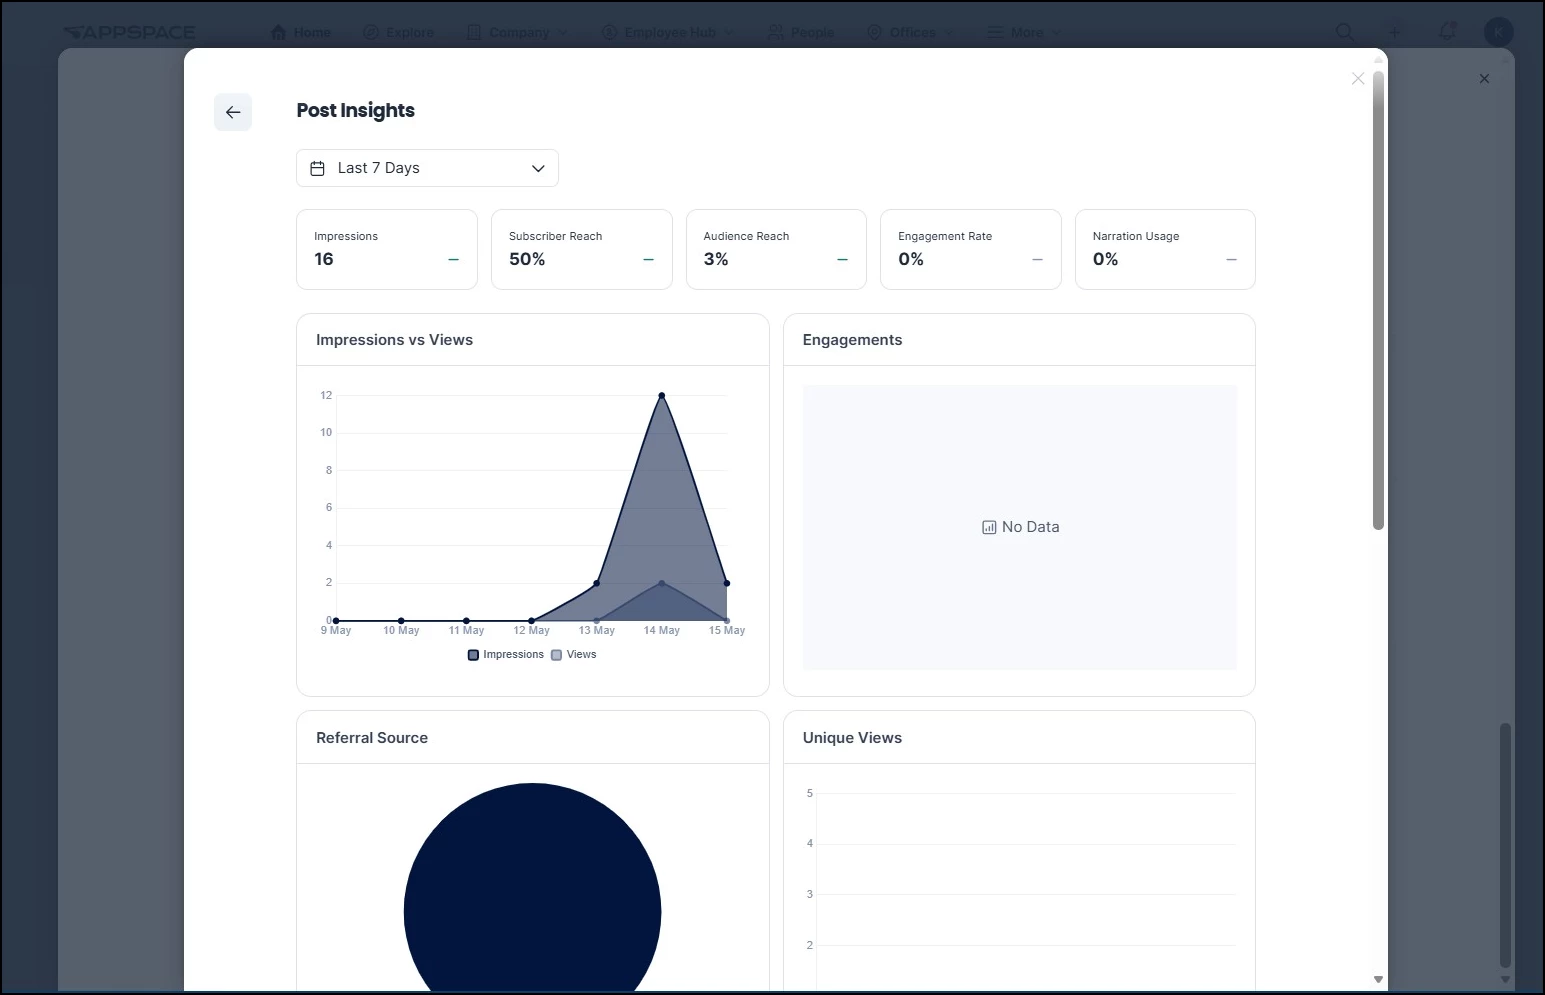
- Click View More to open the detailed insights dashboard.
The summary view at the bottom of each piece of content displays:
- Impressions
- Audience Reach
- Engagement Rate
The detailed dashboard (accessed via View More) includes additional data points:
- Narration Usage
- Impressions vs Views
- Engagements
- Referral Source
- Unique Views
- View Trends
- Impressions
- Read Level
Tip: You can click into any of these data points to see the full list of information and download the data as an Excel file.
Understanding Your Metrics
The tables below define each metric you will encounter across the intranet insights dashboards in Appspace, grouped by where they appear.
Intranet Dashboard
These metrics appear on the Intranet system dashboard in the Insights module.
| Metric | What It Measures | Why It Matters |
|---|---|---|
| Active Intranet Users | Number of unique users who visited the intranet during the selected period | Shows how much of your workforce is actively using the intranet |
| New Posts | Number of new posts published during the selected period | Indicates content production velocity and editorial activity |
| Total Post Views | Total number of post views during the selected period | Measures overall content consumption on the intranet |
| Post View Trends | Trend chart showing post views over time | Identifies peaks and drops in readership to inform publishing strategy |
| Impressions vs Views | Compares how often posts appeared in feeds vs. how often they were opened | Reveals the gap between visibility and engagement; a low ratio may indicate headlines or thumbnails need improvement |
| Content by Type | Breakdown of intranet content by type | Shows the mix of content formats and whether to diversify |
| Top Spaces | Ranking of Spaces by activity | Identifies which Communities and Topics are driving the most intranet traffic |
| Post Attachment Opens | How often users open attachments within posts | Indicates whether supplementary materials are adding value |
| Post Media Views | How often users view embedded media (images, videos) within posts | Indicates whether embedded media is adding value or being skipped |
Space Insights and Feed-Level Insights
These metrics appear when viewing analytics for Spaces (Communities and Topics) in the Console, or for individual feeds in the Employee View.
| Metric | What It Measures | Why It Matters |
|---|---|---|
| Total Users | Total number of users with access to the Space or feed | Establishes your addressable audience size for reach calculations |
| New Posts | Number of new posts created during the selected period | Indicates content production velocity and editorial activity |
| Active Users | Number of unique users who engaged during the selected period | Shows how much of your workforce is actively participating |
| Visits | Total number of visits to a Space, feed, or page | Measures traffic volume and helps identify high-traffic areas |
| Engagements | Total user interactions (comments, reactions, shares) | Gauges how actively employees are participating beyond just reading |
| Engagement Rate | Percentage of users who interacted by commenting or reacting | Key indicator of content quality and relevance to your audience |
| Referral Source | Where users came from: the Intranet, email, Microsoft Teams, or other channels | Helps you understand which distribution channels are most effective at driving traffic |
| View Trends | When your audience is reading, broken down by time of day or day of the week | Informs optimal publishing and scheduling times for maximum reach |
| Top Viewed Content | Ranking of content items by number of views | Identifies what topics and formats resonate most with your workforce |
| Most Visited Feeds | Ranking of feeds (Channels, Communities, Topics) by visit volume | Shows which areas of your intranet are getting the most traffic |
| Posts by Type | Breakdown of posts by content type | Helps you understand the content mix and whether to diversify formats |
Content-Level Insights
These metrics appear when viewing analytics for individual Stories, Pages, and Posts.
| Metric | What It Measures | Why It Matters |
|---|---|---|
| Impressions | Total times content appeared in a user's feed, whether or not they opened it | Measures content visibility and distribution reach |
| Audience Reach | Percentage of unique users from your total audience that saw or engaged with content | Shows what share of your workforce your communications are actually reaching |
| Engagement Rate | Percentage of users who interacted by commenting or reacting | Key indicator of content quality and relevance to your audience |
| Unique Views | Count of individual users who opened the content (deduplicated) | Tells you how many people actually read your content, not just saw it in a feed |
| Impressions vs Views | Compares how often content appeared in feeds vs. how often it was actually opened | Reveals the gap between visibility and readership; a low ratio may indicate headlines or thumbnails need improvement |
| Narration Usage | How many users listened to the AI-powered audio narration of the content | Shows adoption of audio consumption and accessibility features |
| Engagements | Total user interactions (comments, reactions, shares) | Gauges how actively employees are participating beyond just reading |
| Referral Source | Where users came from: the Intranet, email, Microsoft Teams, or other channels | Helps you understand which distribution channels are most effective at driving traffic |
| View Trends | When your audience is reading, broken down by time of day or day of the week | Informs optimal publishing and scheduling times for maximum reach |
| Read Level | How far users scrolled through longer content (depth of consumption) | Indicates whether employees are reading content fully or dropping off early |
| Media Views | Percentage of users who viewed media content (images, videos) within a post | Indicates whether embedded media is adding value or being skipped |
Campaigns
These metrics appear across the Campaigns system dashboard and the individual campaign Overview and Insights tabs.
Campaigns System Dashboard
| Metric | What It Measures | Why It Matters |
|---|---|---|
| Campaign Engagement | Engagement trends across all campaigns over time | Shows overall engagement momentum across your campaign portfolio |
| Campaign View Trends | Heatmap of when audiences view campaign content by day and hour | Informs optimal scheduling for campaign content |
| Campaign Impression Trends | Heatmap of when campaign content appears in feeds by day and hour | Shows distribution timing patterns across campaigns |
| Campaign Top Content | Ranking of content items across all campaigns by views | Identifies the highest-performing content across your campaigns |
| Campaign Content by Type | Breakdown of campaign content by format type | Shows the content mix across your campaigns |
| Top Campaigns By Engagement | Ranking of campaigns by engagement | Identifies which campaign initiatives are driving the most interaction |
| Top Campaigns By Views | Ranking of campaigns by total views | Shows which campaigns are getting the most visibility |
| Campaign Referrer Source | Where campaign traffic originates across all campaigns | Helps you understand which channels drive the most campaign traffic |
| Campaign Audience Trends | Unique audience activity across campaigns over time | Tracks whether your campaigns are reaching more people over time |
Individual Campaign: Overview Tab
| Metric | What It Measures | Why It Matters |
|---|---|---|
| Total Audience | Total number of users in the campaign's target audience | Establishes the addressable audience for the campaign |
| Engagement | Overall engagement rate for the campaign | Quick indicator of how actively the audience is interacting |
| Reach | Percentage of the target audience that has seen campaign content | Shows what share of your audience the campaign is reaching |
| Content | Total content items in the campaign | Shows the volume of content powering the campaign |
| Audience Trends | How audience engagement evolves over the campaign duration | Helps you see momentum and determine optimal campaign length |
| Top Content by Engagement | Ranks content items by engagement | Identifies which content is driving the most interaction |
| Top Content by Reach | Ranks content items by audience reach | Shows which content is being seen by the most people |
Individual Campaign: Insights Tab
| Metric | What It Measures | Why It Matters |
|---|---|---|
| Total Users | Total users with access to the campaign | Establishes your addressable audience for the campaign |
| New Content | New content items added during the selected period | Tracks content production within the campaign |
| Active Users | Unique users who engaged during the selected period | Shows active participation in the campaign |
| Engagement Rate | Percentage of users who interacted with campaign content | Key indicator of campaign content quality and relevance |
| Reach | Percentage of the audience that saw campaign content | Shows distribution effectiveness for the campaign |
| Referral Source | Where campaign traffic is coming from | Helps identify which channels are most effective at driving campaign traffic |
| View Trends | Heatmap showing when the audience views campaign content (Overview, Hourly, Daily) | Informs optimal timing for campaign content distribution |
| Top Viewed Content | Ranking of campaign content by views | Identifies which campaign content is being consumed most |
| Content by Type | Breakdown of campaign content by format type | Shows the content mix within the campaign |
| Impressions | Total times campaign content appeared in user feeds | Measures campaign content visibility and distribution |